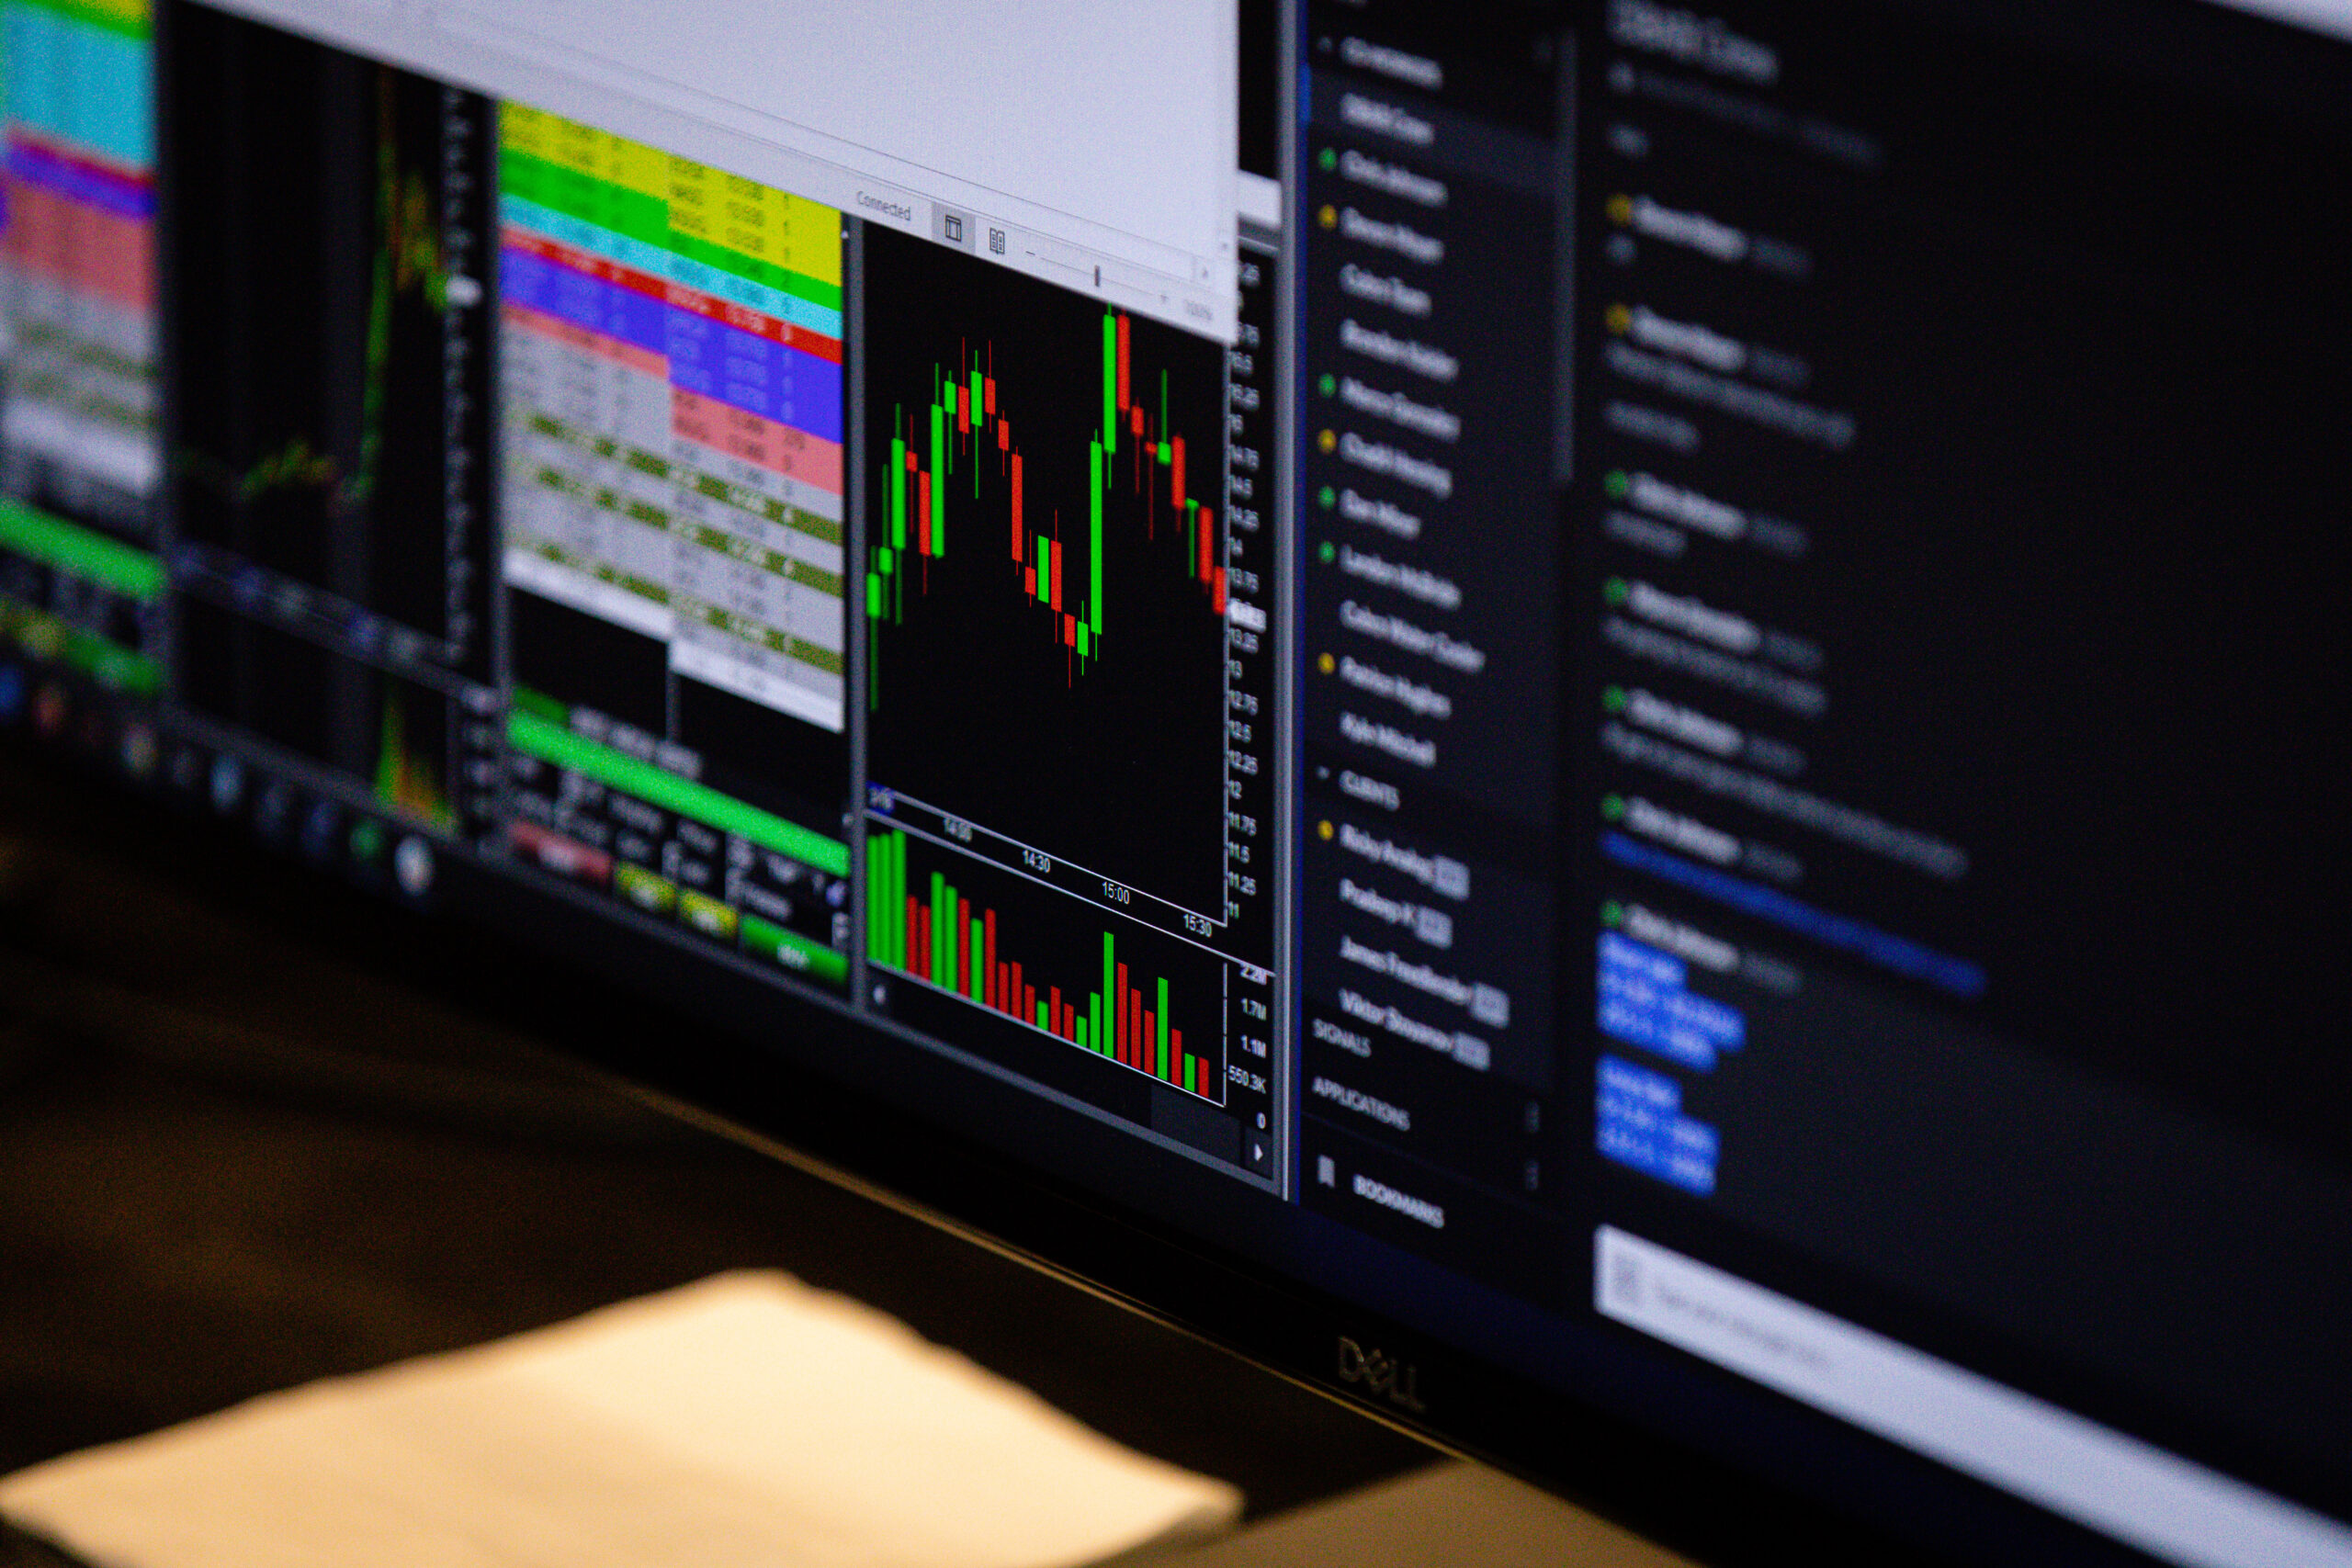
Candlesticks are an important tool that all traders should be familiar with. This valuable tool tells you what the price is doing in more detail. If you’re able to read them, you’ll know where a stock’s price has been and how it’s acting.
Let’s use a simple example (see the picture below).
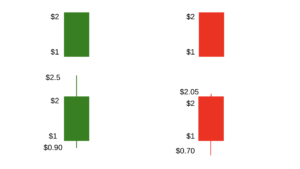
Anytime the candlestick is green, it means that it opened at a lower price and closed at a higher price. And if it’s red, it’s the opposite; it means that it opened at a higher price and closed at a lower price.
In the example above, see the top row. The green candlestick represents a stock that opened at $1 per share and closed at $2. The stock represented by the red one opened at $2 and closed at $1.
Sometimes, candlesticks have vertical lines attached to them on the bottom or top called wicks. Wicks mean that the stock had some range in its bid and ask, so the stock opened and closed at an average of those prices where the solid-colored rectangle begins or ends.
Look at the bottom row of the graph. The stock on the left opened at $1 and closed at $2, but it also hit $0.90 and $2.50 on the way. And the red candlestick shows that it had a range between $2.05 and $0.70, but the opening price was $2, and the closing price averaged at $1.
How does a red candlestick hit a number higher than the open price? Once the stock opened, it shot up to $2.05 for a quick second and then plummeted right away. It hit $0.70 on the way down but eventually went up to $1 closing price.
Now that you know what candlesticks and their numbers stand for, how should you use them in your day trading? First, it’s important to note that a single candlestick can never tell a full story. Instead, you need to see it in the right context. For example, looking at several of them as they cover a longer timeframe can tell you if the stock has any potential to go higher or lower. For example, if the stock opens at $1 and closes at $2 with no bouncing around, it may mean that its position is strong, and there’s a good probability that it will go a bit higher. However, never rely on a single indicator like that. It is imperative to always check for multiple signals and other data when doing research or choosing a new trade.
Following the candlesticks allows you to notice nuanced fluctuations in how a stock’s price has changed over time. This then gives you an advantage of recognizing patterns, drawing conclusions, and finding an edge in your day trading.
Check out more information for day traders inresources offered by Cobra Trading. And if you need help opening an account with us, feel free toreach out!

